Futures Hustler
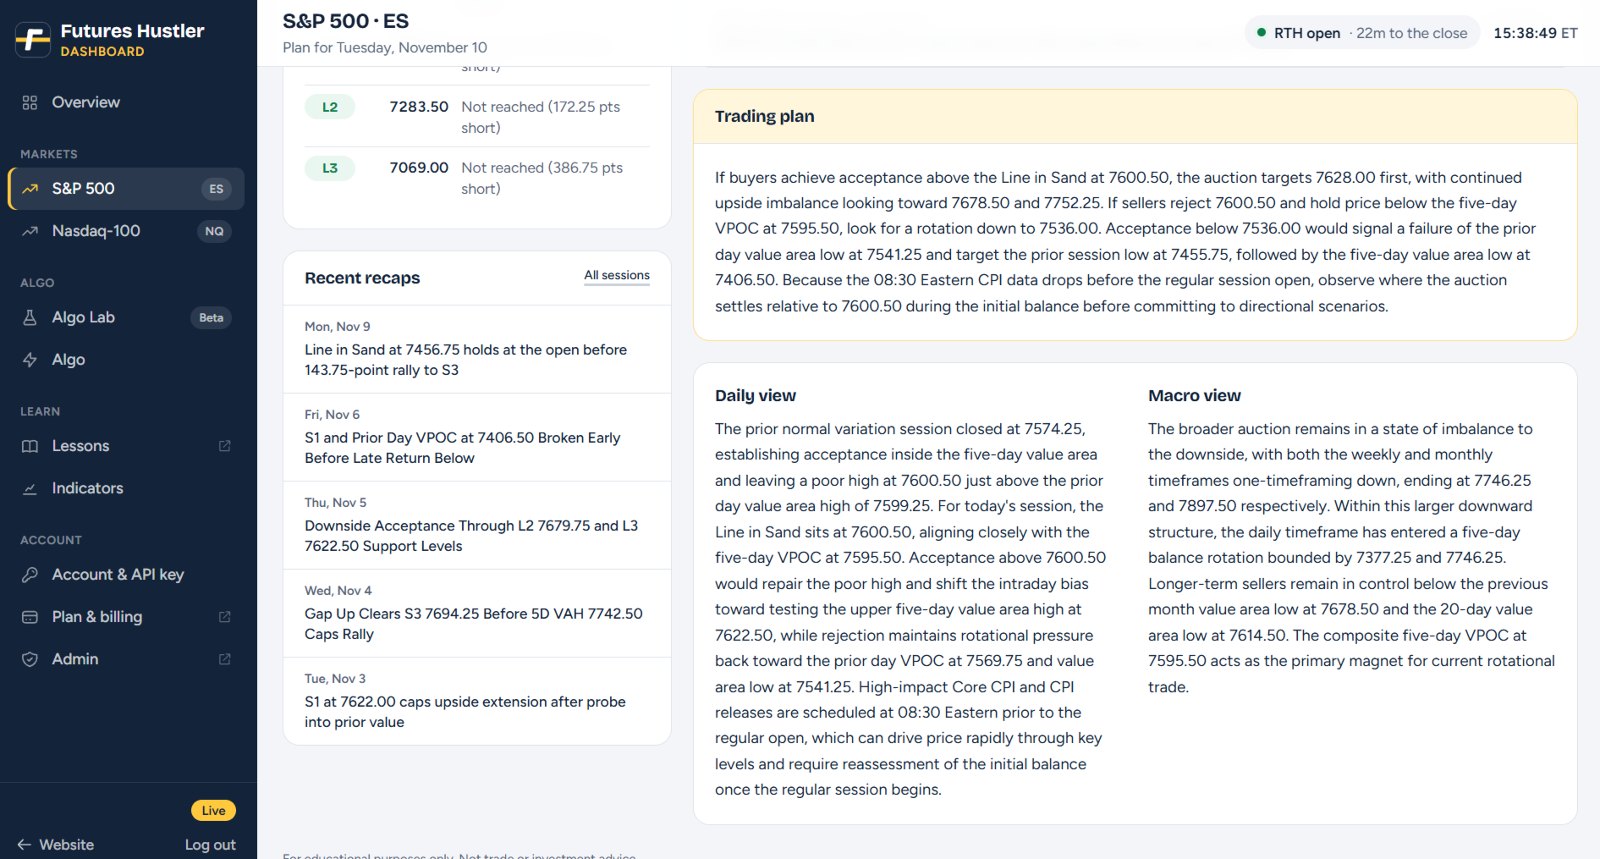
Most traders start the day with ten tabs open: a calendar, a chart, someone's levels on X, a news feed, and a notebook with yesterday's ideas. The Futures Hustler dashboard puts all of that in one place for ES and NQ, from the night before the open to the final hour. Here's a tour of what members see when they log in.
1. The Overview: the one-screen morning read
The dashboard opens on today's plan, with a live ET clock and a countdown to the close of the regular session.
Risk on / risk off gauge. A single score that sums up the market's tone. Under it, ES and NQ get their own rows: price against the line in sand, the bull/bear check count, daily, weekly and monthly timeframe direction, the move against the prior close, and NQ vs ES relative strength.
ES and NQ cards. Each shows the line in sand (LIS), the lean for the day, the level ladder (S2, S1, LIS, prior close, L1, L2) and the latest update with its scenario.
Economic calendar. High-impact releases like CPI or NFP are flagged, so you know when volatility is scheduled.
Last session recaps for both contracts, plus a summary of the Algo Lab results.
If you only have two minutes before the open, this screen is enough.
2. The ES and NQ workspaces: the full plan
Each contract has its own workspace with everything behind the day's plan:
Key levels table from S3 to L3, each with a confluence rating and its distance from the line in sand.
About 25 higher-timeframe levels: prior month, week and day highs, lows and value areas, 20-day and 5-day VPOC, the 20/50/100/200 moving averages, monthly VWAP and the weekly midpoint.
"What moves the pointer": last price against the LIS, the bull, bear and neutral check counts, the range so far, and the next high-impact news.
A live 5-minute chart with the initial balance and the plan's levels drawn on it.
Intraday updates through the session. The next day's plan lands after the close (about 4:15 PM ET), followed by a premarket check at 9:15 and updates at 9:45, 10:30, 13:00 and 15:00 ET.
3. Sessions archive: a graded track record
Every session is kept: line in sand, open, high, low, close, range, where price closed relative to the LIS, and a recap. Open any day and every level is graded as reached and held, reached and closed beyond, traded through or not reached, with a chart of how the session actually traded.
We don't hide the bad days. You can scroll back and judge the levels yourself before you trust them with your money.
4. Algo Lab (beta): results in the open
Algo Lab runs systematic strategies on simulated accounts (MES RTH, MES 24/7 Globex, an NQ account and an ES conservative account) and publishes everything:
equity curves with drawdown shading
net P/L, win rate, profit factor, average win and loss, and max drawdown
the open position and why it was entered
a time-stamped journal, newest first, where the "Atlas" reader explains each trade it takes and each one it passes on
Losing trades sit right next to the winners. That's the point.
5. Indicators for your own charts
Members don't have to copy levels by hand. Indicators for MotiveWave, Sierra Chart, NinjaTrader 8 and Quantower pull the daily ES and NQ levels straight onto your chart from your private member key, with a setup guide for each platform.
Trading futures involves substantial risk of loss and is not suitable for every investor. Algo Lab results are simulated. Nothing on Futures Hustler is financial advice.