Futures Hustler
What is Market Auction Theory?
Market Auction Theory (MAT) says one simple thing: every market is an auction, and price moves to find the level where the most business gets done. Price is not random. It travels up to look for sellers and down to look for buyers, and it stays where both sides are happy to trade.
Think of a local car market. If a seller asks too much, nobody buys, so the price drops. If the price is too low, buyers rush in and the seller raises it. After some back and forth, most cars change hands around one "fair" price. Financial markets do exactly the same thing, only thousands of times per minute.
The idea comes from J. Peter Steidlmayer, a trader at the Chicago Board of Trade, who created the Market Profile chart in the 1980s to show this auction visually. Jim Dalton later explained it for a wider audience in Mind Over Markets and Markets in Profile. Today the same thinking is used with Volume Profile on almost any platform.
The practical benefit for a trader: instead of guessing where price "should" go, you read where the auction is accepting price and where it is rejecting it. Those areas become your trading zones.
The two states of every market: balance and imbalance
The market has one job: facilitate trade. It does that by moving between two states, and knowing which state you are in tells you which kind of trade to take.
Balance (rotation). Buyers and sellers agree on value. Price rotates back and forth inside a range, like a ball bouncing between two walls. Volume builds up in the middle. Most of the time (roughly 70–80% of sessions) markets are in balance.
Imbalance (trend). New information arrives (news, data, a large player) and one side becomes much stronger. Price moves directionally out of the old range to search for a new fair price. Volume is thin along the way because price is moving too fast for much trading to happen.
The cycle never stops: balance → breakout → imbalance → new balance → breakout again.
State | What price does | What you do |
|---|---|---|
Balance | Rotates inside a range | Fade the edges: sell high, buy low, target the middle |
Imbalance | Moves in one direction | Go with the move, buy pullbacks in an uptrend, sell rallies in a downtrend |
The most common beginner mistake is using a balance tactic in an imbalance market (fading a strong trend) or a trend tactic in a balance market (chasing breakouts that fail). MAT is mainly a tool for telling the two apart.
The building blocks: reading the auction
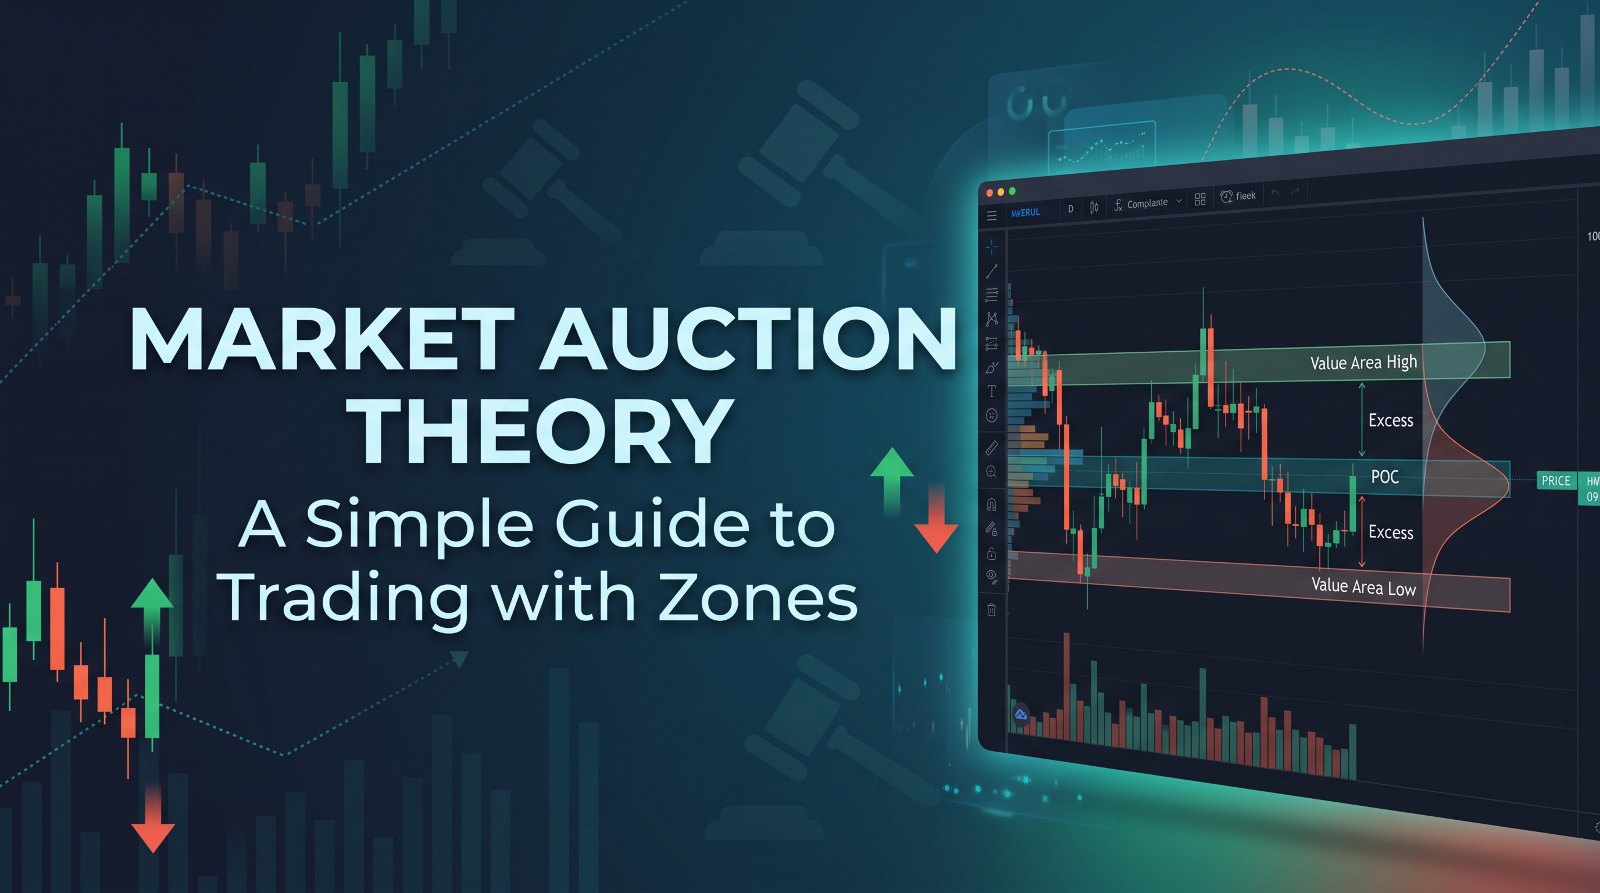
To see the auction you need a profile: a sideways histogram that shows how much trading happened at each price. Market Profile counts time (30-minute letters called TPOs); Volume Profile counts contracts or shares. Both tell the same story, and the terms below apply to both.
Term | What it is | What it tells you |
|---|---|---|
POC (Point of Control) | The single price with the most trading | The "fairest" price of the session; price is often pulled back to it like a magnet |
Value Area (VA) | The price range holding about 70% of the session's activity | Where the market agreed on value |
VAH / VAL | Value Area High / Value Area Low, the top and bottom of value | The edges of fair value; the first places to watch for reaction |
HVN (High Volume Node) | A thick part of the profile | Acceptance; price slows down and rotates here |
LVN (Low Volume Node) | A thin part of the profile | Rejection; price moved through fast and tends to move fast again |
Initial Balance (IB) | The high and low of the first hour of the session | The first range set by day traders; a break of it shows which side is stronger |
Excess (tail) | A long thin tail at the session high or low | A finished auction; one side was firmly rejected, a strong reference level |
Poor high / poor low | A flat, blunt top or bottom with no tail | An unfinished auction; the market often comes back to "repair" it |
One rule ties all of these together: time and volume at a price mean acceptance; a fast move away from a price means rejection. Accepted prices attract price back. Rejected prices push price away.
Who is in the auction
Not every buyer or seller has the same goal. MAT sorts market participants in two useful ways.
By timeframe. Day timeframe traders open and close positions within the session; they create most of the rotation inside the range. Other timeframe (OTF) traders are funds, institutions and swing traders who hold for days or weeks. They are fewer but much larger, and they are the ones who move price out of balance. When you see a strong one-directional move with little pullback, the OTF is usually active.
By behaviour.
Responsive traders react to price that has moved away from value. They buy below value because it looks cheap and sell above value because it looks expensive. Responsive activity keeps the market in balance.
Initiative traders act against the idea of fair value. They buy above value or sell below value because they believe value itself is changing. Initiative activity creates trends.
The question to ask all day is simple: is the market responding to old value or initiating new value? If price leaves the value area and quickly returns, responsive traders won. If price leaves and keeps building volume outside, initiative traders won and value is moving.
Zones in auction terms
A zone is a price area where the auction has already shown us something: acceptance, rejection or unfinished business. Unlike classic support and resistance drawn from chart highs and lows, auction zones come from where trading actually happened, so they have a reason to matter.
Use areas, not single lines. Markets rarely turn at an exact tick, so give each zone a small width (for example a few ticks around the POC, or the full width of an LVN).
Zone | How to draw it | Expected behaviour |
|---|---|---|
Value zone | Previous session's VAL to VAH | Price rotates inside; edges act as first reaction points |
POC zone | A few ticks around the previous POC (and older "naked" POCs that price has not revisited) | Magnet; price is often drawn back to it, then pauses |
HVN zone | Thick parts of a multi-day or weekly composite profile | Slows price down; good targets, poor entry points in the middle |
LVN zone | Thin gaps between two HVNs | Price either rejects sharply or slices through fast toward the next HVN |
Excess zone | The tail at a prior session high or low | Strong reaction expected; a clean break through it signals a real change |
Poor high / low zone | Flat prior session extreme | Likely to be revisited and broken; treat as a target, not a wall |
Balance edges | Top and bottom of a multi-day balance area | Fade them while balance holds; trade the breakout when they fail |
Build zones on two layers. The higher timeframe layer (weekly or multi-day composite profile) gives you the big map and the main targets. The daily layer (yesterday's VAH, VAL, POC, high and low, plus today's initial balance) gives you the levels you will actually trade off.
Applying it: five core scenarios
The single most useful question at the start of every session is: where did price open compared with yesterday's value area, and is it being accepted or rejected there? The answer points you to one of the scenarios below.
1. Open inside value: expect rotation
Price opens between yesterday's VAL and VAH. Buyers and sellers still agree, so the day often stays in balance.
Trade: sell near VAH, buy near VAL, once price shows rejection there (a failed push, a tail on a lower timeframe, volume drying up).
Target: the POC first, then the opposite edge.
Stop: just outside the zone you faded. If price builds volume outside value, balance has failed; step aside.
2. Open outside value and accepted: go with it
Price opens above VAH (or below VAL) and holds there, building volume and not returning to value in the first hour.
Trade: this is initiative activity. Buy pullbacks into the old VAH (now support) or the first-hour low; for a gap down, sell rallies into the old VAL.
Target: the next higher-timeframe zone: a naked POC, an HVN, or a poor high/low above.
Stop: back inside the old value area.
3. Open outside value and rejected: the 80% rule
Price opens outside value, then moves back inside and stays there. The market tried a new price and rejected it.
The rule: if price re-enters the prior value area and holds there for two consecutive 30-minute periods, there is a high chance it travels to the other side of value. The name is old trader folklore; treat it as a strong tendency, not a guaranteed 80%.
Trade: enter after acceptance back inside, with the POC as the first target and the opposite edge as the second.
Stop: outside the value edge where price re-entered.
4. Breakout from multi-day balance
Several days overlap in the same range; a composite profile shows one fat balance area. Eventually one side wins.
Look above and below for acceptance: a breakout that builds volume outside the balance and holds a retest of the edge is real. A breakout that snaps back inside (a "look above and fail") often runs to the other side of the balance.
Target: a measured move roughly equal to the balance height, or the next HVN.
5. LVN reactions
Low volume nodes are where the auction moved fast before. When price returns, it tends to repeat that behaviour.
Rejection play: price arrives at an LVN from an HVN and stalls; trade back toward the HVN it came from.
Slice-through play: price enters the LVN with momentum; expect it to travel quickly to the next HVN on the other side.
Avoid: entries in the middle of an HVN, where price chops in both directions.
Whatever the scenario, wait for the auction to confirm at your zone. The zone tells you where to look; price behaviour at the zone tells you whether to act.
A simple daily routine
The whole method fits into a short routine you can repeat every session.
Before the open
Open a weekly or multi-day composite profile. Mark the main HVNs, LVNs and any balance area edges. This is your big map.
Mark yesterday's VAH, VAL, POC, high and low. Note whether the high and low had excess (tails) or were poor (flat).
Mark any naked POCs from recent sessions that price has not touched since.
Ask: was yesterday a balance day or a trend day? Is value moving higher, lower, or overlapping with the day before?
Write down two or three "if this, then that" plans, for example: if we open above VAH and hold, I look for longs on a pullback to VAH, targeting the naked POC.
During the session
Note where price opens versus yesterday's value: inside, above or below.
Watch the first hour. Is price accepted outside value, or does it return inside?
Note the initial balance range. A narrow IB often leads to a range extension later; a wide IB often means a quieter rest of the day.
Trade only at your marked zones, only after price confirms there, and only in the direction your scenario supports.
Re-check every hour: is value (the developing POC and value area) moving, or staying put?
After the session
Screenshot the profile and note which scenario played out.
Compare it with your morning plan. Over time this review is what builds real skill.
Common beginner mistakes
Treating zones as magic lines. A zone is a place to pay attention, not an automatic entry. Always wait for acceptance or rejection to show up.
Fading a trend day. When price is accepted outside value and the OTF is pushing, selling "because it's too high" is the costliest error in auction trading.
Chasing breakouts in balance. Most attempts to leave a balance area fail. Wait for volume to build outside before trusting it.
Too many levels. Ten lines on a chart means every price is a level. Keep the few that matter: yesterday's value, key HVN/LVNs, naked POCs, poor highs/lows.
Ignoring the higher timeframe. A perfect daily long into a big weekly HVN overhead has a limited target. Always know where the next big zone sits.
Trading the middle. Entries in the middle of value or inside a fat HVN have no edge; the best trades start at the edges.
Recap
The market is an auction that moves between balance and imbalance while it searches for fair value. Volume Profile and Market Profile show where value was accepted (HVNs, POC, value area) and where it was rejected (LVNs, tails). Those areas become your zones. Each day, compare the open with yesterday's value, decide whether the market is accepting or rejecting new prices, and pick the matching scenario: fade the edges in balance, go with the move in imbalance.
In the next parts of this series, we can go deeper into each scenario with real chart examples.
This article is for education only and is not financial advice. Trading futures and other leveraged products carries a high risk of loss. Practice on a simulator before using real money, and always trade with a defined stop.